Navigation:
System Configuration Sensors > Configuring Sensors > Calibration - General > Calibration - Using Synergy >> Setting a User Defined Graph Scale
Setting a User Defined Graph Scale

Contents
Setting the Graph Scale
Each Sensor/Transmitter has a Graph Scale for each channel, setting the upper and lower limits of any graph plots.
There are three ways to scale a graph:
•Use the Default Scale (See Default Calibration Values).
•Use Auto Scale.
•Use a User Defined Graph Scale as set here.
To Set a User Defined Graph Scale
1.Access the Calibration property entries as outlined in: Editing a Sensor's Calibration Settings.
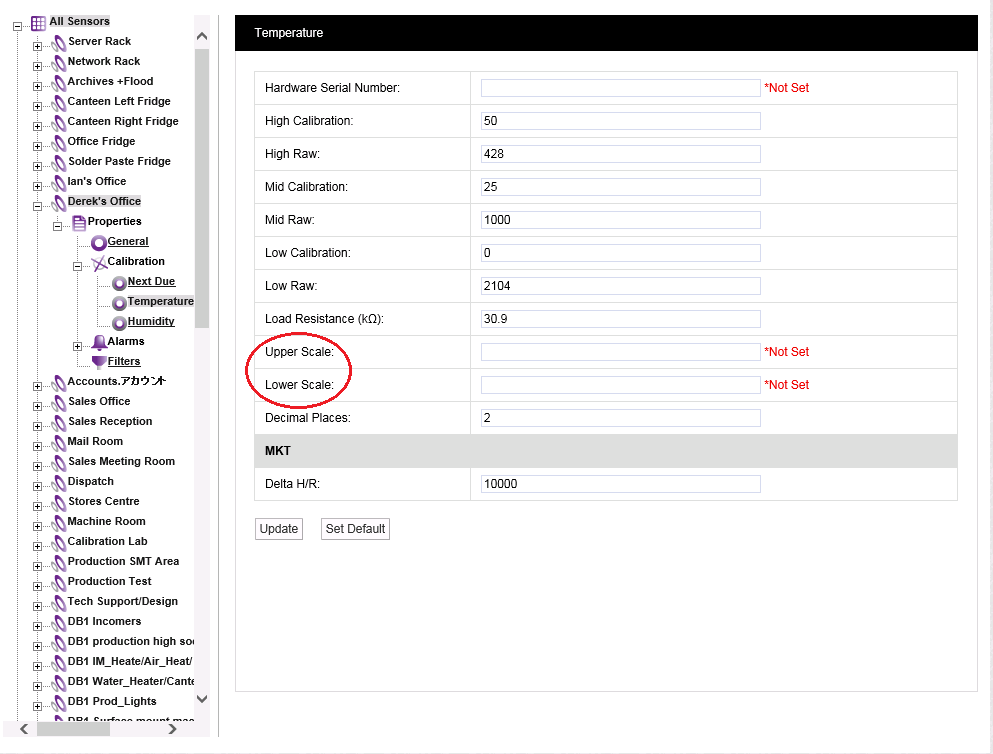
2.Click the on the Temperature or Humidity icon to display the Temperature or Humidity window for the selected Sensor/Transmitter. See Figure 408 below.
3.Enter the required upper and lower Graph Scale limits into the Upper Scale: and Lower Scale: fields respectively. See Figure 408 below:
Figure 408
| Note: | Graph Scale ranges can be set to be as narrow or as wide as required, but be aware that if a Graph Scale range is set across a very narrow range of values and the sensor starts to read outside of this range, nothing will be seen on the graph. |
4.Select Update to confirm the details.
•If the Update has been successful, the following message will be displayed. See 409 below:
Figure 409
