Navigation:
System Configuration Admin > Sites >> Adding Sites to the Dashboard
Adding Sites to the Dashboard

Contents
The Dashboard can be considered as the System's Homepage, displaying an overview of the Sites and Groups associated with the System, in either Graphical or Text format, and providing the main point of access to the System's functionality.
Previously defined Sites (see the Sites section) can be added to the Dashboard.
•Creating a Site's System Overview
•Editing a Site's System Overview
•Removing Sites from the Dashboard
Creating a Site's System Overview
A System Overview defines which information relating to a particular Site is displayed on the Dashboard.
•A System Overview should, ideally, be created for a Site before adding it to the Dashboard.
To create a System Overview for a Site:
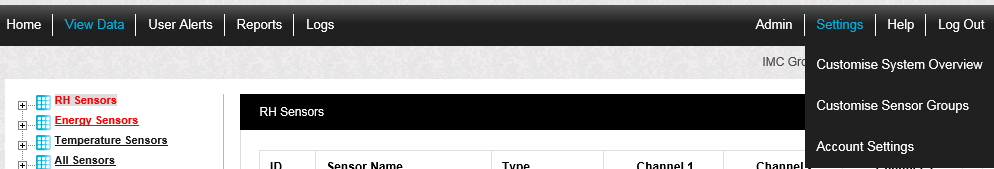
1.Select Settings from the right-hand menu bar to display the Settings drop down menu. See Figure 259 below:
Figure 259
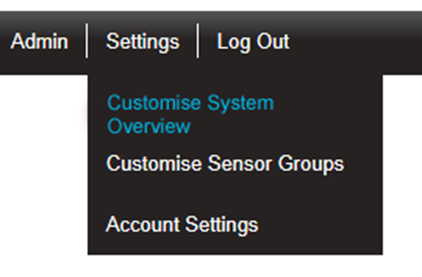
2. From the Settings drop down menu, select Customise System Overview. See Figure 260 below:
Figure 260
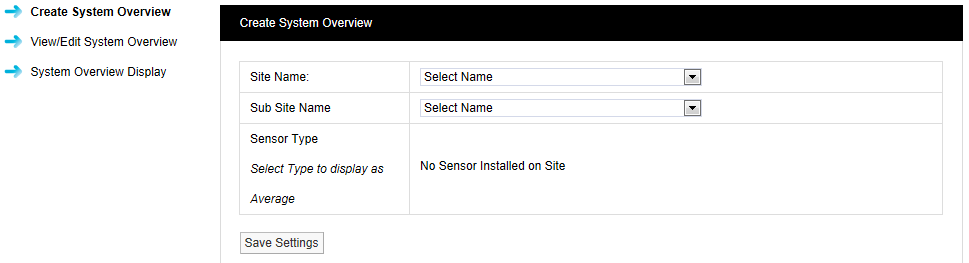
•The Create System Overview window is displayed enabling you to define the information displayed on the Site's Dashboard icon. See Figure 261 below:
Figure 261
3.From the Site Name: drop down menu (containing previously defined Sites), select the Site that you wish to define a Dashboard System Overview for.
•The Sensor Type list will then populated with a list of the Site's associated Sensor Types. See Figure 262 below:
Figure 262
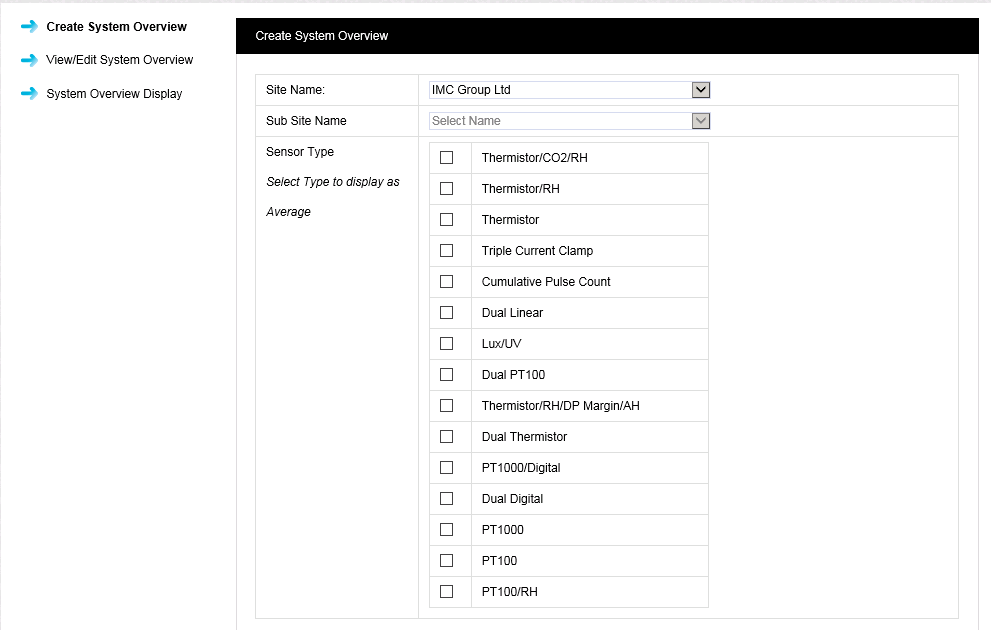
•If the selected Site has a Sub Site or Sub Sites, the Sub Site Name drop down list will be available and you should select the Sub Site you wish to display on the Site's Dashboard icon from it.
•If the selected Site does not have Sub Site or Sub Sites, the Sub Site Name drop down list will be greyed out.
There are two types of information that can be viewed on a Site's Dashboard icon:
•Sensor/Transmitter Averages
•System Alarm Status, giving an overview of Sensor/Transmitters in alarm condition over the Site.
To select the Site's Sensor/Transmitter Averages for display on the Site's Dashboard icon:
Click in the tick box next to the Sensor/Transmitter Type you would like to see Sensor/Transmitter Averages for.
•This option should only be used if all the Site's Sensor/Transmitters of the chosen type are measuring the same parameter.
To display the Site's System Alarms Status on the Site's Dashboard icon, leave the tick boxes clear.
Editing a Site's System Overview
To edit an existing Site's System Overview:
1.Select Settings from the right-hand menu bar to display the Settings drop down menu. See Figure 263 below:
Figure 263
3. From the Settings drop down menu, select Customise System Overview. See Figure 264 below:
Figure 264
•The Create System Overview window is displayed.
4.Select View/Edit System Overview from the left-hand menu to display the System Overview window. See Figure 265 below:
Figure 265
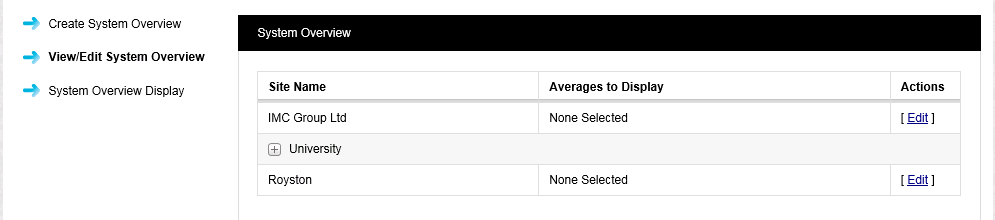
•Available Sites are displayed in the Site Name column.
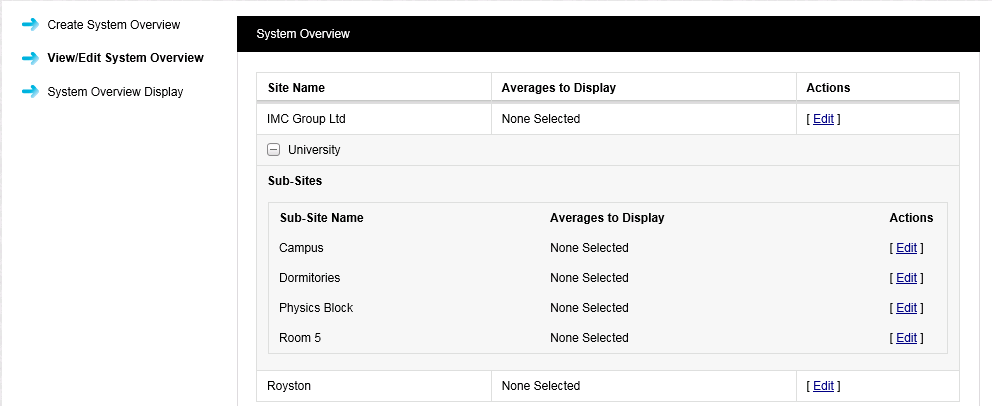
•Sites with associated Sub Sites have a + icon next to the Site Name; clicking on this will display a list of associated Sub Sites. See Figure 266 below:
Figure 266
5.Click on [Edit] on the line associated with the Site/System Overview to be edited to display the Edit System Overview window. See Figure 267 below:
Figure 267
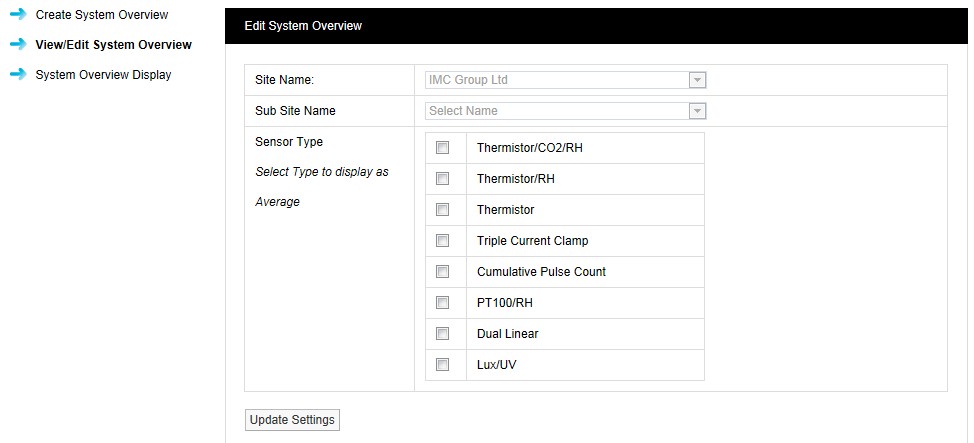
•If there are no Sensor/Transmitter Types selected by ticks in the Sensor Type boxes, the Site will show System Alarm Status information in the Site's Dashboard icon.
•If there are Sensor/Transmitter Types selected by ticks in the Sensor Type boxes, the Site will be show Sensor/Transmitter Averages in the Site's Dashboard icon.
6.Make changes as required and select Update Settings to action and save the changes.
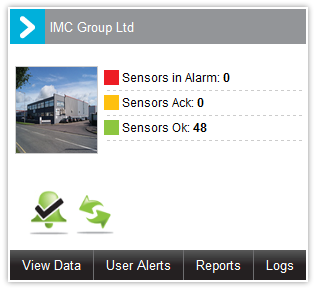
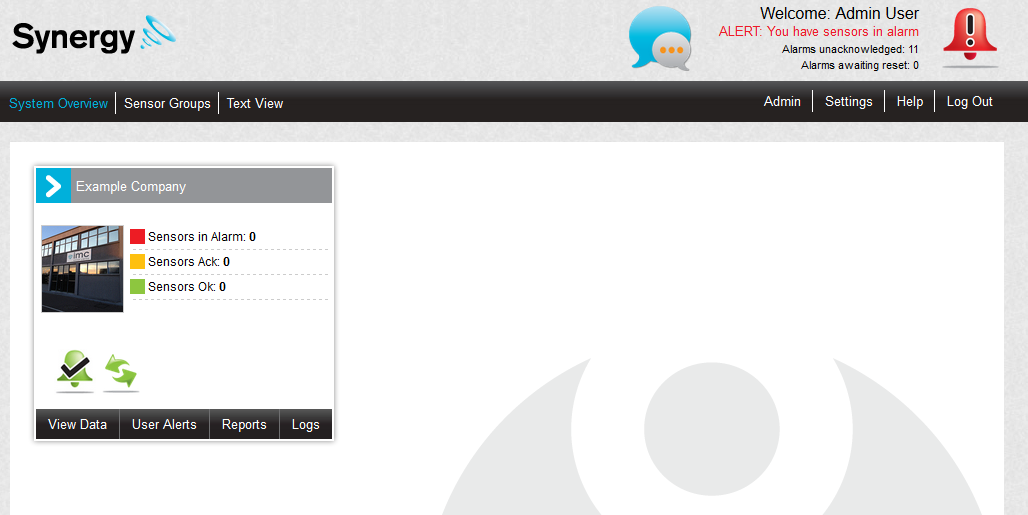
•See Figure 268 below for an example of a Site with System Alarm Status information displayed on the its Dashboard icon.
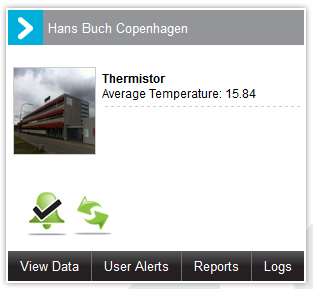
•See Figure 269 below for a Site with Sensor/Transmitter Averages displayed on its Dashboard icon.
Figure 268
|
Figure 269
|
Synergy is installed with one default Site which will appear on the Dashboard as shown in Figure 270 below:
Figure 270
To add more Sites to the Dashboard:
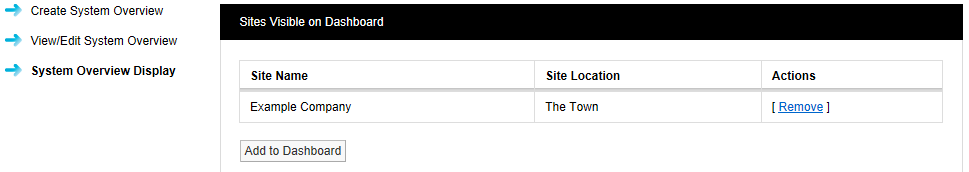
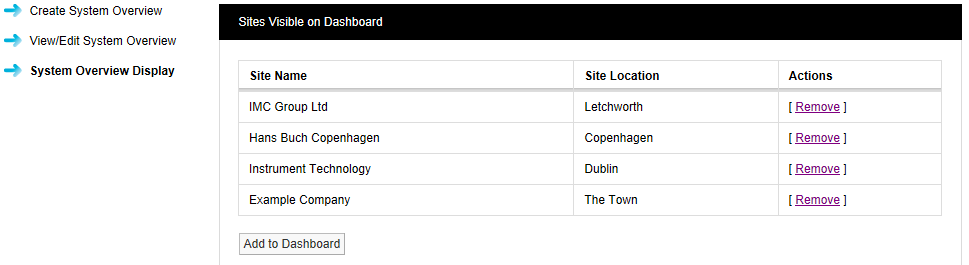
1.Select System Overview from the left-hand menu to display the Sites Visible on Dashboard window. See Figure 271 below:
Figure 272
2.Select Add to Dashboard to display the Sites Available to Add on Dashboard window, listing Sites available to be added to the Dashboard. See Figure 273 below:
Figure 273
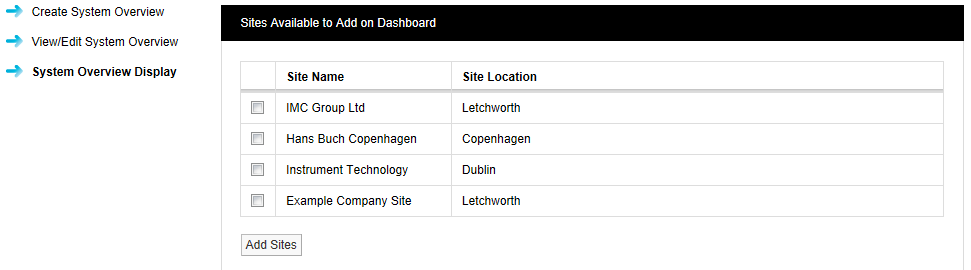
3.Select the Sites that you would like to see on the Dashboard (maximum 6 Sites).
•To select a Site or Sites, click in the checkbox(es) next to the required Site Name(s). See Figure 274 below:
Figure 274
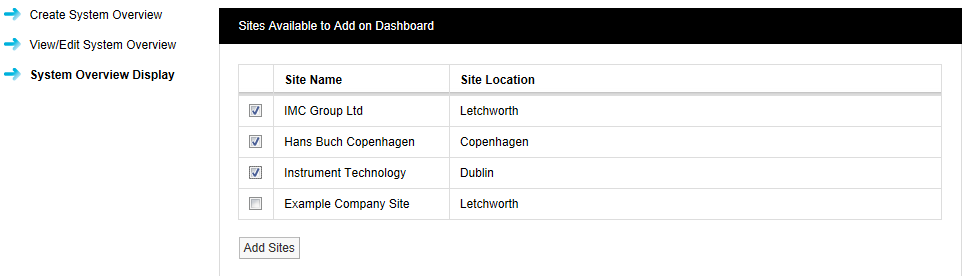
4.When happy with your selections, click on Add Sites.
•As message window will be displayed, asking you to confirm that you want to add the selected Sites to the Dashboard. See Figure 275 below:
Figure 275
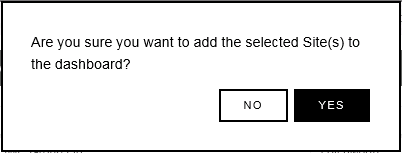
5.Select OK to continue or Cancel to stop the addition of the selected Sites to the Dashboard.
•Clicking on OK displays the Sites Visible on Dashboard window. See Figure 276 below:
Figure 276
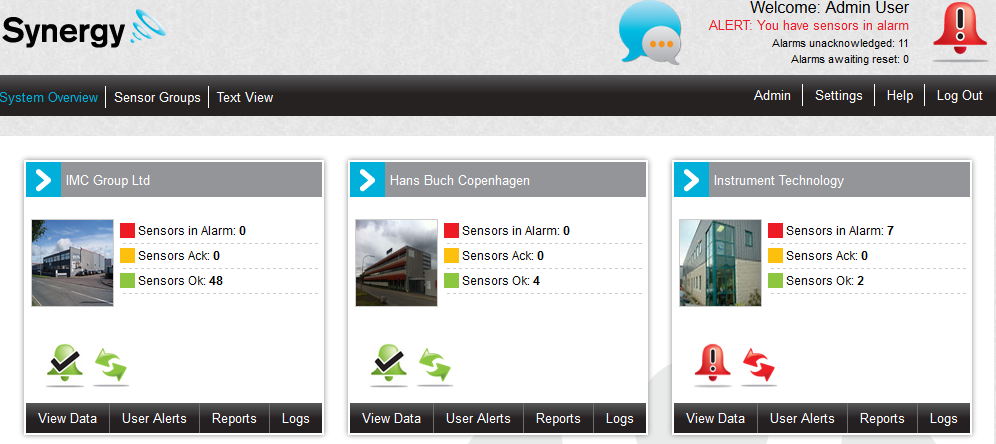
• The Dashboard will now display added Sites. See Figure 277 below:
Figure 277
Removing Sites from the Dashboard
The Dashboard can be changed at any time, further Sites can be added (as above) or Sites can be removed.
To remove a Site from the Dashboard:
1.Select System Overview from the left-hand menu to display the Sites Visible on Dashboard window. See Figure 278 below:
Figure 279
2.Click on [Remove] in the Actions column on the line corresponding to the Site to be removed.
•As message window will be displayed, asking you to confirm that you want to remove the selected Sites from the Dashboard. See Figure 280 below:
Figure 280
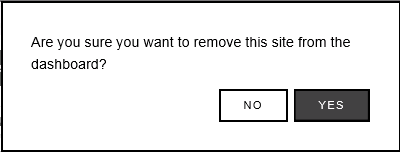
3.Click on Yes to continue and remove the selected Site from the Dashboard.
Click on No to cancel the removal.