Navigation:
Synergy Outputs > Alarm Management >> System Status and Alarm Overview
System Status and Alarm Overview

Contents
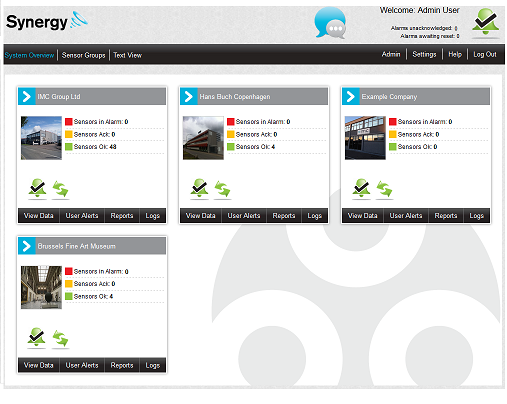
When the User first logs onto Synergy, the first screen displayed (the Dashboard/Overview Screen) gives an overview of the system, including its Alarm Status.
•System Status Information for the entire System is always displayed in the top-right hand corner of the screen.
•System Messages are accessed via the System Messages Alert icon which is always displayed in the top-right hand corner of the screen.
Both Email and SMS Notifications can be setup to send System Messages. For information on this, see Email System Group and SMS Systen Group.
•Information on individual Sites can also be accessed via their Site Icons.
See Figures 568 and 569 below:
Once the User has navigated away from the Dashboard/Overview Screen, the Site Icons can be accessed by:
Either:
1.Clicking on Admin on the main menu bar to display the Admin menu bar. See Figure 570 below:
Figure 570
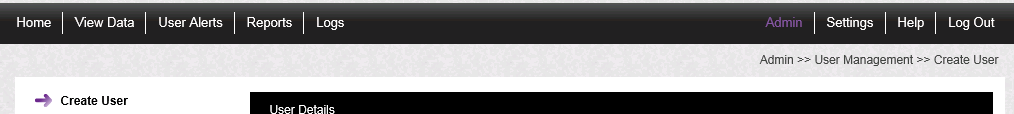
2.Clicking on Home in the menu bar displays the System Overview window showing all available Site Icons.
Or:
Clicking on System Overview in the main menu bar to display the System Overview window showing all available Site Icons.
System Status Information is always displayed at the top right-hand corner of the screen regardless of where the User has navigated to in Synergy.
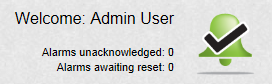
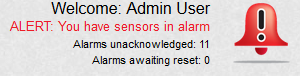
The following System Status information is always displayed in the top right-hand corner of the screen. See Figure 571 below:
•The User currently logged in; Admin User in this example.
•The Alarm Status of the entire system. The Alarm icon gives an indication of the Alarm Status of the entire system.
•The number of unacknowledged alarms.
•The number of alarms awaiting reset.
Figure 571
|
|
System Messages can be viewed by clicking on the System Message Alert icon which is always displayed in the top right-hand corner of the screen. See Figure 572 below:
Figure 572
|
|
|


The three coloured dots indicate the System Message status.
•White: there are no system messages
•Amber: there no new unread system messages
•Red: there are new unread system messages
Both Email and SMS Notifications can be setup to send System Messages. For information on this, see Email System Group and SMS Systen Group.
The individual Site Icons show the Alarm Status and Communications Status for that specific Site. See Figures 573, 574 and 575below:
Alarm Status symbols are the same as those displayed in the System Status Information.
Communication Status symbols signify the following:
|
The green icon indicates that communications to all Control Devices, such as SR2s, associated with the Site are operating normally. |
|
The red icon indicates that communications have been lost to one or more of the Site's Control Devices. In this instance, entries will be added to the Activity Log to be downloaded when communications are restored. |
Figure 573
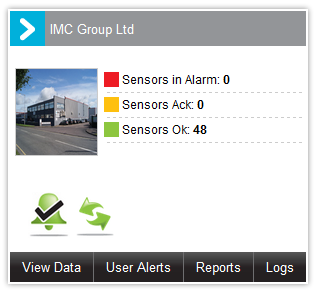
•In the above example we can see that we have no sensors in Alarm, no sensors acknowledged, and 48 sensors OK.
Control Device communications are operating normally.
Figure 574
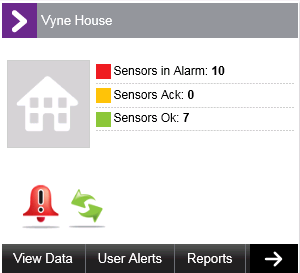
•In the above example we can see that we have 10 sensors in Alarm, no sensors acknowledged, and 7 sensors OK.
Control Device communications are operating normally.
Figure 575
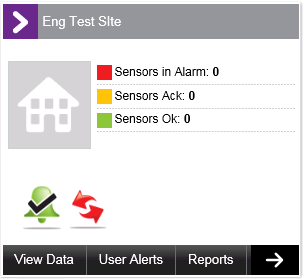
•In the above example we can see that we have 0 sensors in Alarm, no sensors acknowledged and 0 sensors OK.
Control Device communications are not operating normally.
| Note: | Not all Sites on a System may have an icon displayed on the Dashboard/Overview Screen. Additionally, if the system has more than six Sites then not all Sites will be visible on the Dashboard. |
| There may, therefore, be a discrepancy between the Alarms unacknowledged and Alarms waiting reset figures displayed in the top right-hand corner of the dashboard (showing total figures for the entire System) and the totals of these figures shown on the individual Site Icons (showing figures for each displayed Site). |
| Similarly, it is possible that the message ALERT: You have sensors in alarm may be displayed in the top right-hand corner of the dashboard, even though none of the displayed Sites appear to be in an Alarm State, if the Site in alarm has not been added to the Dashboard. |
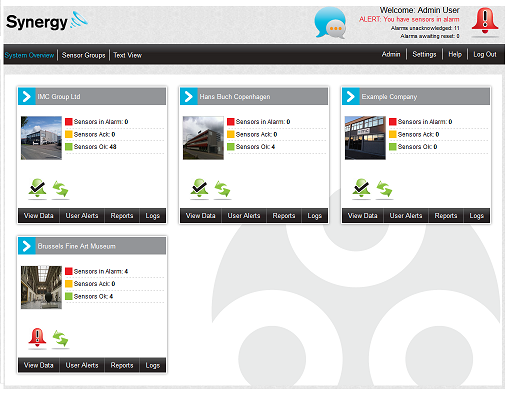
When an Alarm is generated on the system:
•The red Active Alarms icon is displayed: |
|

•The three dots in the System Message icon turn red.
•The message ALERT: You have sensors in alarm appears in Red.
•The number of Alarms on the system is listed next to Alarms unacknowledged. See Figure 576 below:
Figure 576

To view the System Messages click on the System Message Alert icon to display all System Messages. See Figure 577 below.
Figure 577
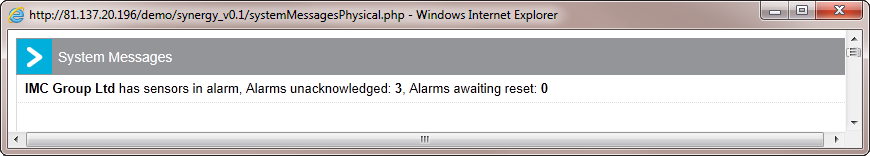
•The listed System Message(s) informs the User of where on the System the Alarm(s) is/are.
•Once this window is closed the three dots in the System Message Alert icon change to amber to indicate that the current live messages have been viewed, but there are no new ones since the last time the System Messages were checked. See Figure 578 below:
Figure 578